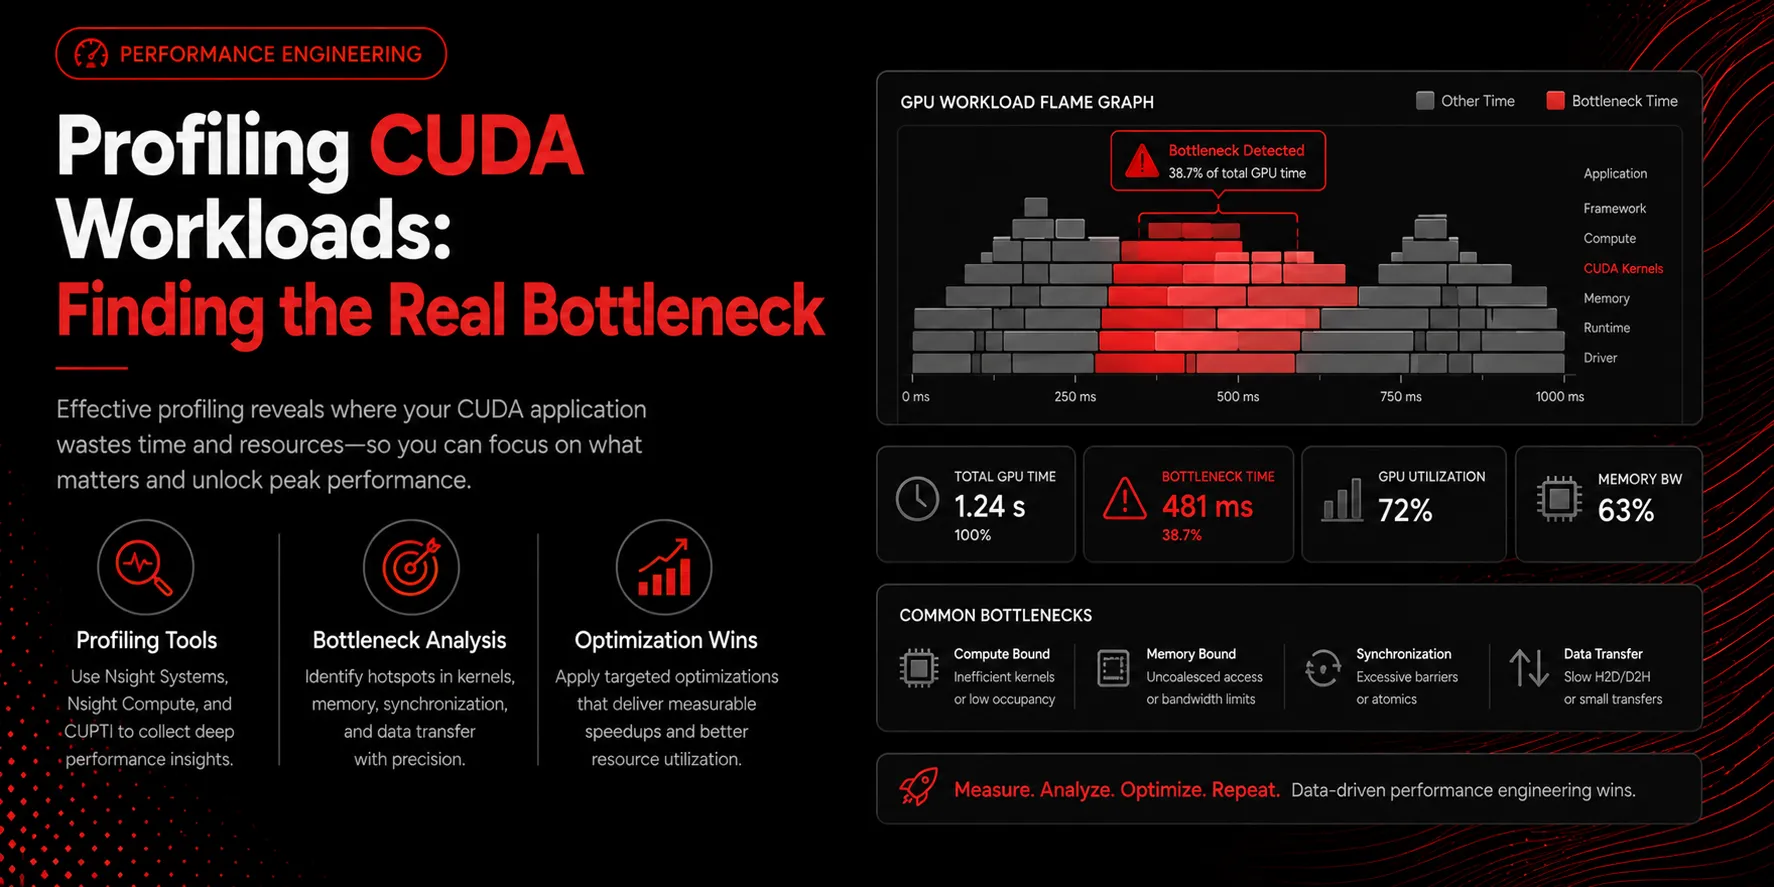
The most common optimization mistake is guessing. Engineers rewrite a kernel that was never the bottleneck and see no improvement. Profiling replaces guesswork with evidence.
Start wide with Nsight Systems
Before zooming into any kernel, capture a system-wide timeline. Nsight Systems shows CPU threads, GPU kernels, and memory transfers on one axis. Often the GPU sits idle waiting on the CPU or on host-to-device copies. If your GPU is only busy 40 percent of the time, no kernel optimization will help until you fix the gaps.
Then zoom in with Nsight Compute
Once you know which kernel dominates GPU time, Nsight Compute reveals why. It reports occupancy, memory throughput, and instruction mix. The central question is simple: are you compute-bound or memory-bound?
Compute-bound versus memory-bound
A memory-bound kernel spends its time waiting for data. The fix is better memory access patterns, coalescing, shared memory, or reduced precision. A compute-bound kernel saturates the arithmetic units, and the fix is doing less work, fusing operations, or using faster instructions. Applying a memory fix to a compute-bound kernel wastes effort.
Beware the host path
Preprocessing, serialization, and Python overhead frequently dominate real workloads. If the timeline shows large CPU regions between kernels, optimize there first.
Key takeaways
- Profile before you optimize; never guess the bottleneck
- Use Nsight Systems for the timeline, Nsight Compute for kernels
- Classify each hot kernel as compute-bound or memory-bound
- A large idle GPU points to a CPU or transfer problem
- Fix the biggest bar on the timeline first